Pie Chart
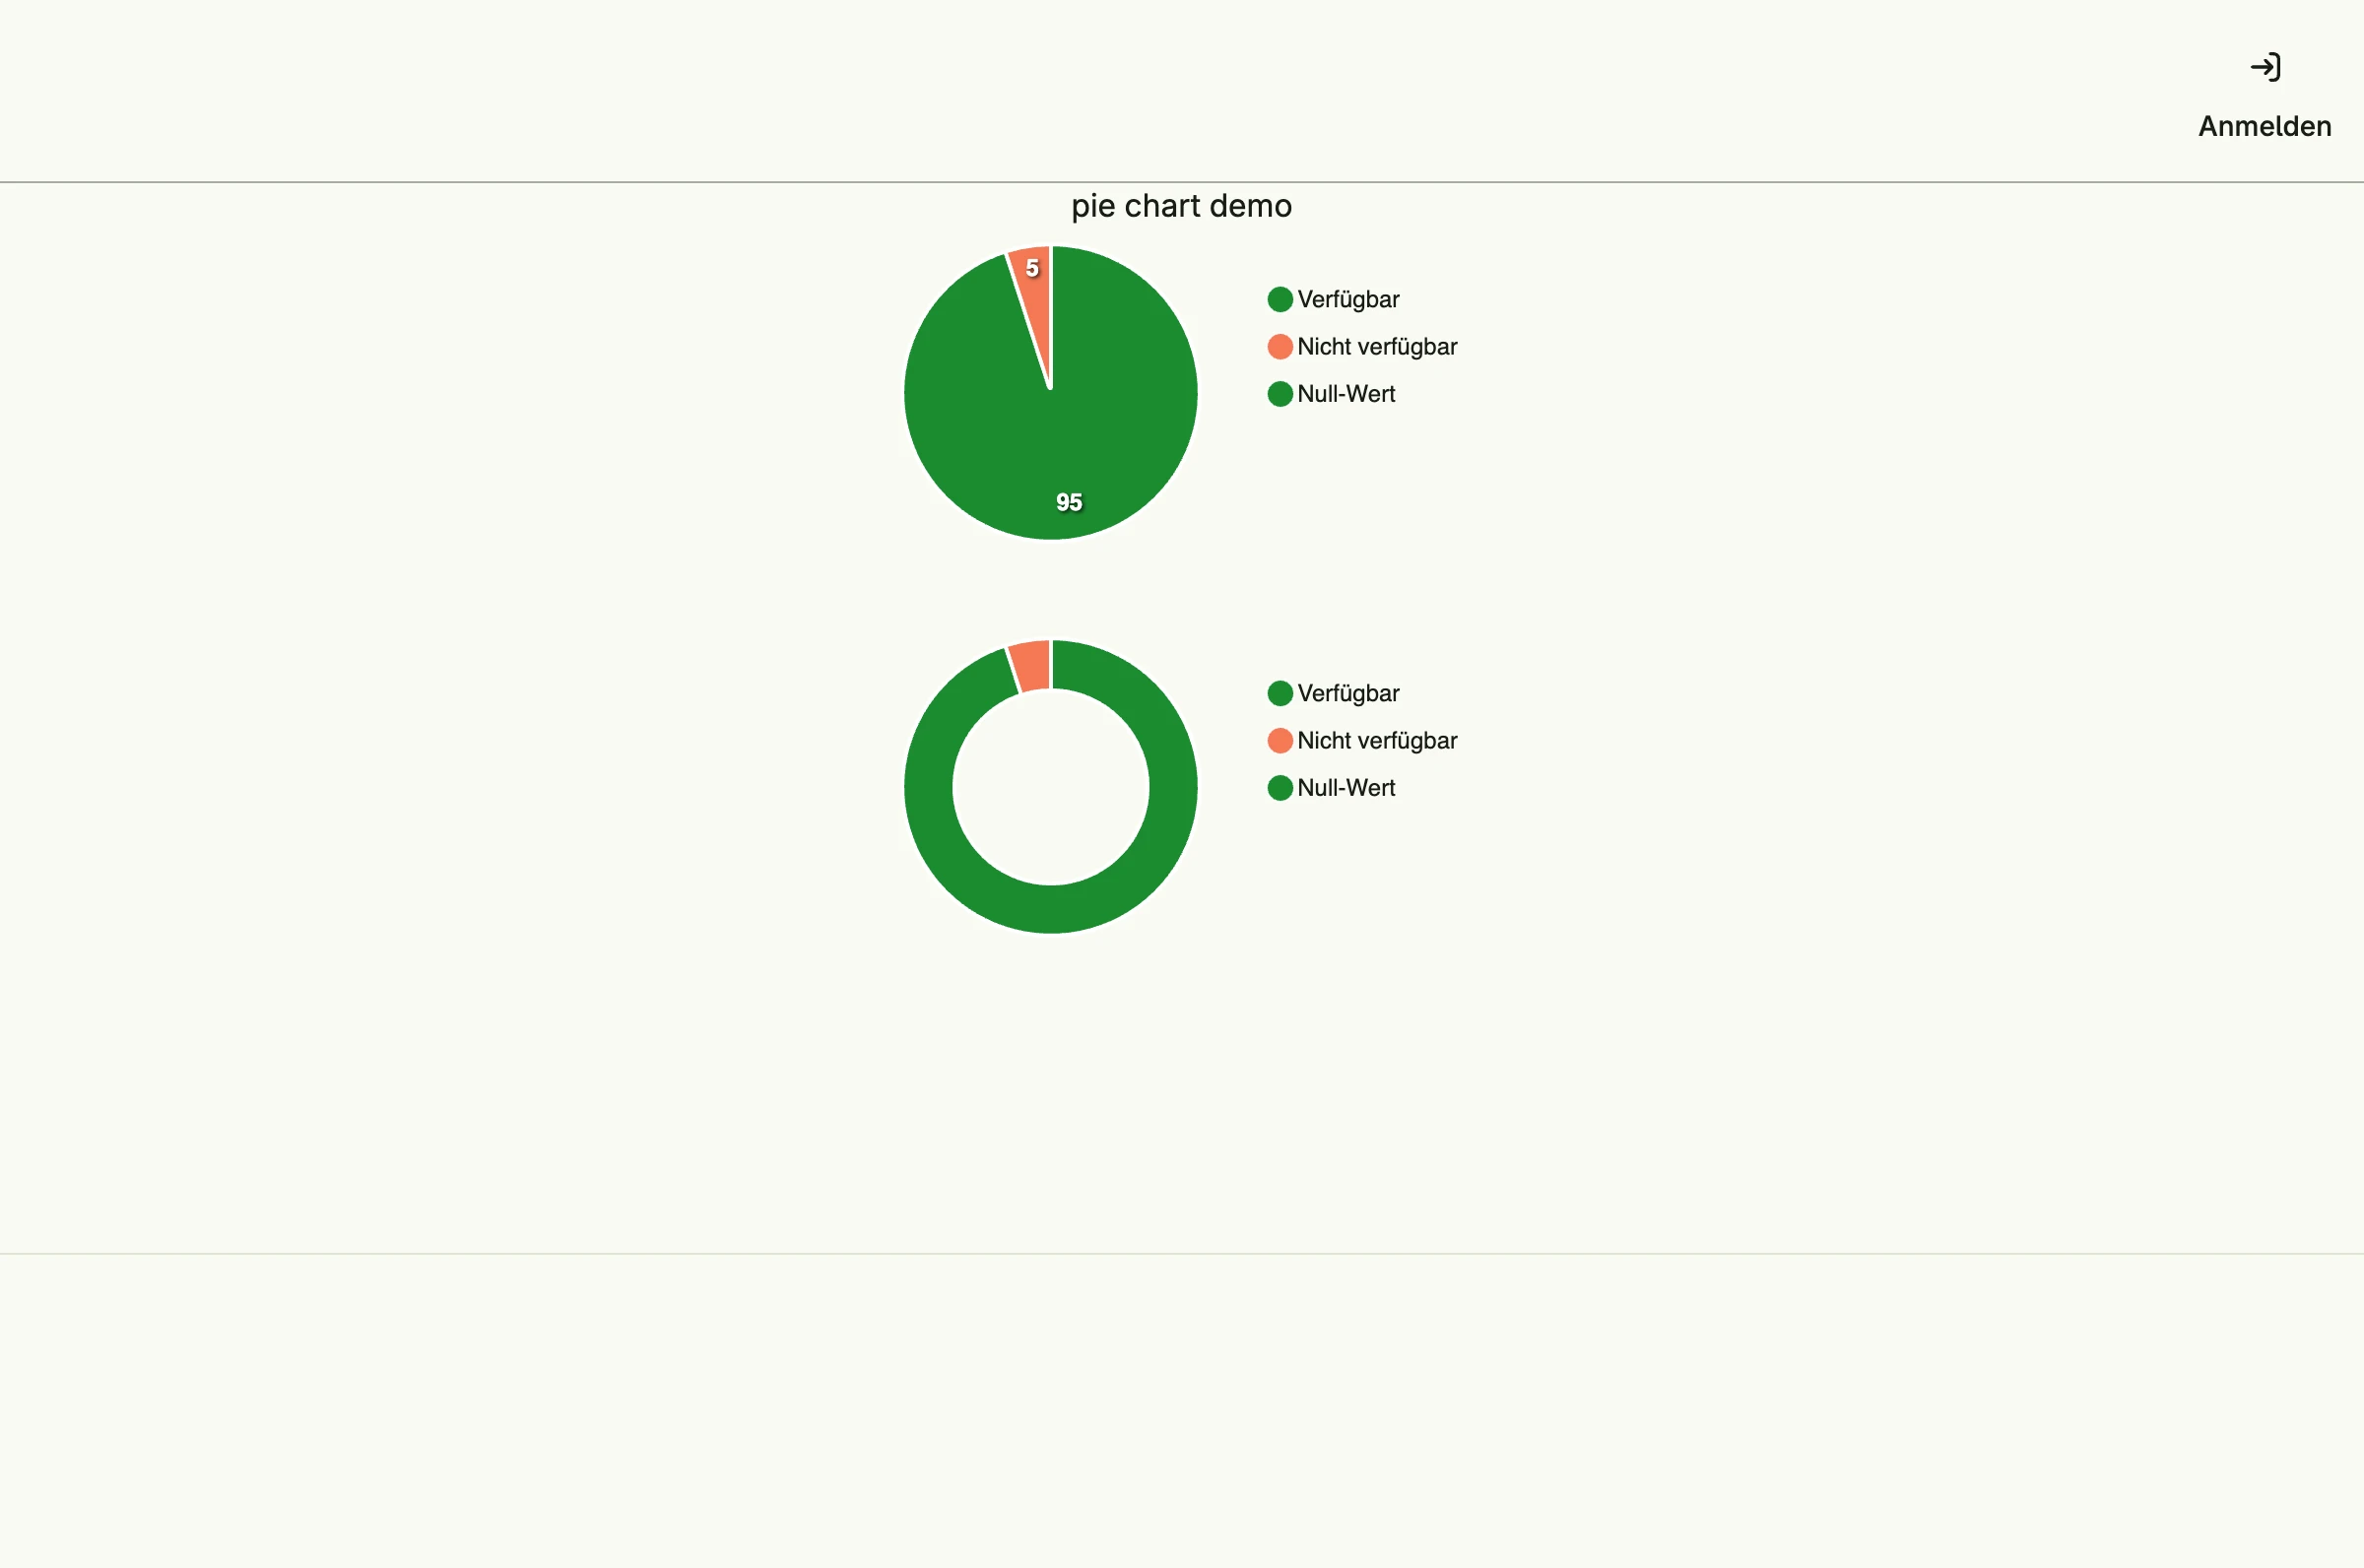
Pie charts with piechart.PieChart, once with absolute values and once as a donut without data labels.
package main

import (
	"time"

	"github.com/worldiety/option"
	"go.wdy.de/nago/application"
	"go.wdy.de/nago/pkg/std"
	"go.wdy.de/nago/presentation/core"
	"go.wdy.de/nago/presentation/ui"
	"go.wdy.de/nago/presentation/ui/chart"
	"go.wdy.de/nago/presentation/ui/piechart"
	"go.wdy.de/nago/web/vuejs"
)

func main() {
	application.Configure(func(cfg *application.Configurator) {
		cfg.SetApplicationID("de.worldiety.tutorial_79")

		cfg.Serve(vuejs.Dist())
		cfg.SetDecorator(cfg.NewScaffold().Decorator())

		option.MustZero(cfg.StandardSystems())
		std.Must(std.Must(cfg.UserManagement()).UseCases.EnableBootstrapAdmin(time.Now().Add(time.Hour), "%6UbRsCuM8N$auy"))

		cfg.RootViewWithDecoration(".", func(wnd core.Window) core.View {
			var pieChartSeries []chart.Series

			pieChartSeries = append(pieChartSeries, chart.Series{
				Label: "Verfügbarkeit",
				DataPoints: []chart.DataPoint{
					{
						X: "Verfügbar",
						Y: 95.45,
					},
					{
						X: "Nicht verfügbar",
						Y: 5,
					},
					{
						X: "Null-Wert",
						Y: 0,
					},
				},
			})

			colorPalette := []ui.Color{
				ui.M0,
				ui.SE0,
			}

			chart1 := chart.Chart{
				Colors:        colorPalette,
				Frame:         ui.Frame{}.Size(ui.L320, ui.L200),
				Downloadable:  false,
				LabelRounding: chart.RoundingRound,
			}
			return ui.VStack(
				ui.Text("pie chart demo"),
				piechart.PieChart(chart1).Series(pieChartSeries).ShowAbsoluteValues(true),
				piechart.PieChart(chart1).Series(pieChartSeries).ShowAsDonut(true).ShowDataLabels(false),
			)
		})
	}).Run()
}
View on GitHub ↗
· run it with go run go.wdy.de/nago/example/cmd/tutorial-79-pie-chart@latest