Flow Chart
An interactive flowchart.FlowChart with custom node content, styled and animated edges, a context menu, a toolbar and automatic layout.
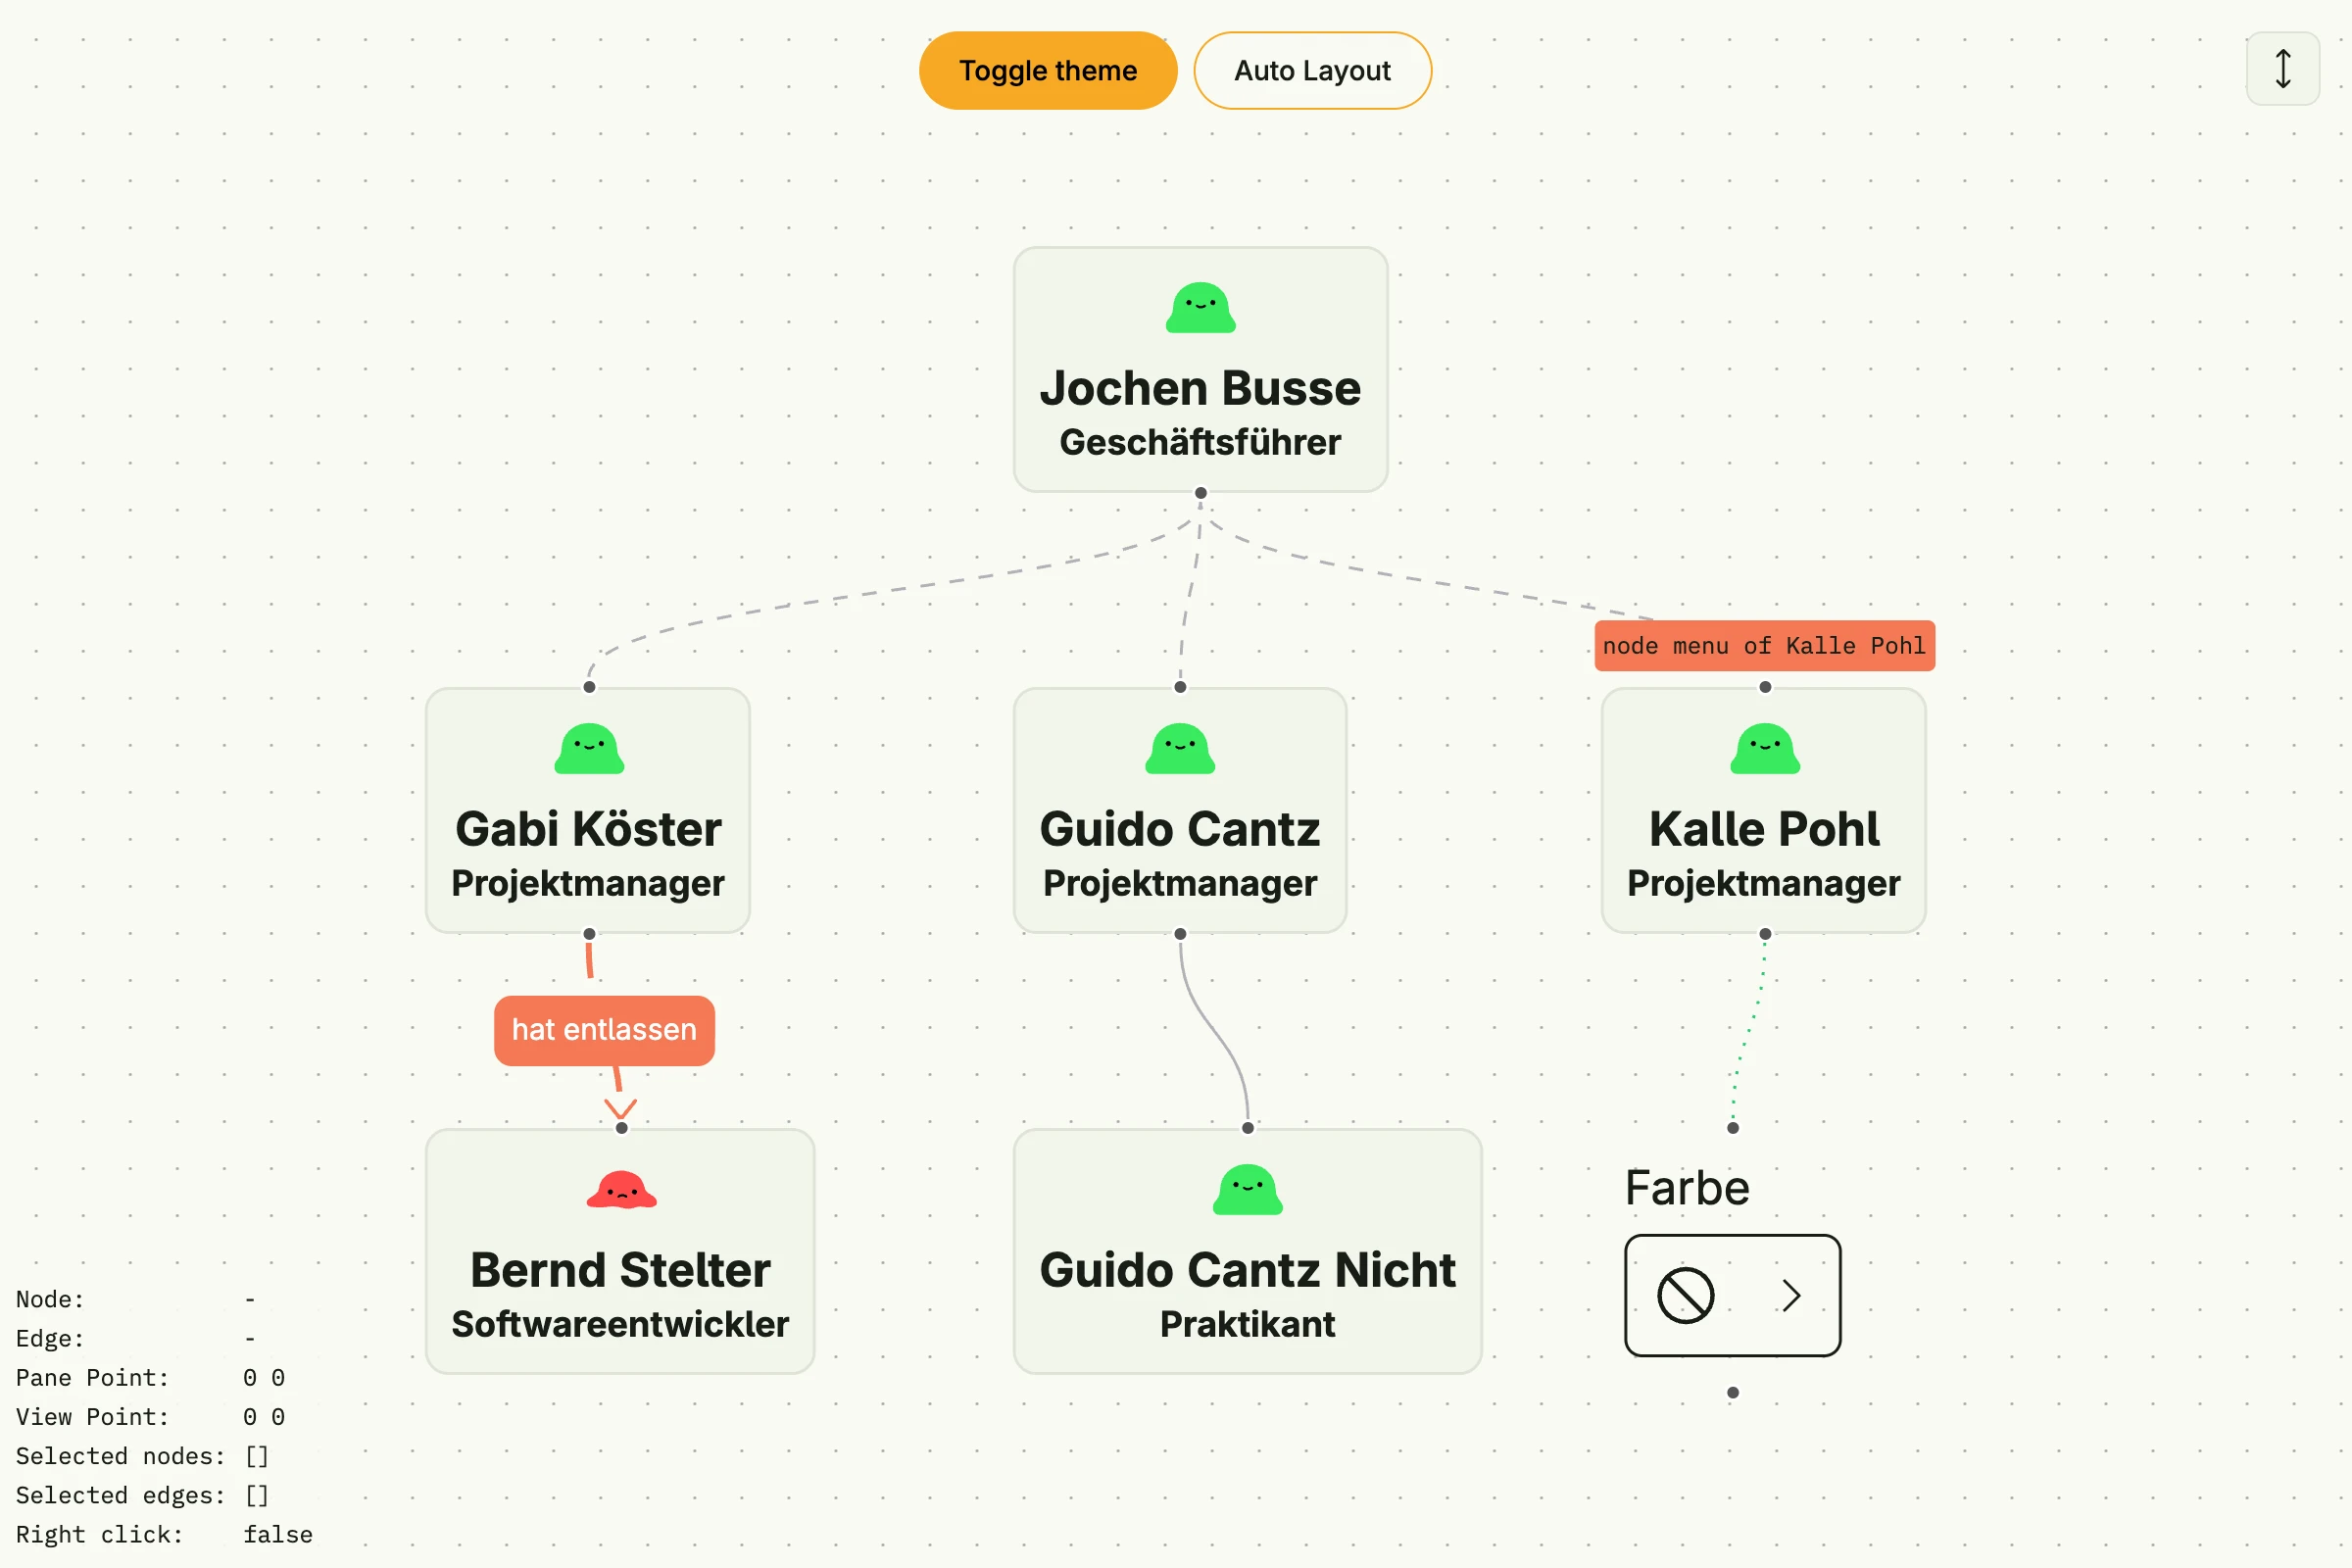
package main

import (
	_ "embed"
	"fmt"
	"strings"

	"go.wdy.de/nago/application"
	"go.wdy.de/nago/presentation/core"
	"go.wdy.de/nago/presentation/ui"
	"go.wdy.de/nago/presentation/ui/colorpicker"
	"go.wdy.de/nago/presentation/ui/flowchart"
	"go.wdy.de/nago/web/vuejs"
)

//go:embed joe_schmoe_green.svg
var JoeSchmoeGreen core.SVG

//go:embed joe_schmoe_red.svg
var JoeSchmoeRed core.SVG

func main() {
	application.Configure(func(cfg *application.Configurator) {
		cfg.SetApplicationID("de.worldiety.tutorial_98")
		cfg.Serve(vuejs.Dist())

		cfg.RootView(".", func(wnd core.Window) core.View {
			colorState := core.StateOf[ui.Color](wnd, "colorState")
			menuVisibleState := core.StateOf[bool](wnd, "menuVisibleState")

			actionState := core.StateOf[flowchart.FlowChartActionData](wnd, "actionState")
			actionState.Observe(func(action flowchart.FlowChartActionData) {
				fmt.Println("Latest action", action)

				if action.Node.ID == "" && action.Edge.ID == "" && action.RightClick {
					menuVisibleState.Set(true)
					return
				}

				menuVisibleState.Set(false)
			})

			nodes := make([]flowchart.Node, 0)
			contents := make([]flowchart.CustomContent, 0)

			jbusseNode, jbusseContent := personNode("jochen-busse", "Jochen Busse", "Geschäftsführer", JoeSchmoeGreen, flowchart.Point{
				X: 100,
				Y: -50,
			}, flowchart.NodeTypeStart, flowchart.NodeStyleDefault)
			nodes = append(nodes, jbusseNode)
			contents = append(contents, jbusseContent)

			gkoesterNode, gkoesterContent := personNode("gabi-koester", "Gabi Köster", "Projektmanager", JoeSchmoeGreen, flowchart.Point{
				X: -100,
				Y: 100,
			}, flowchart.NodeTypeDefault, flowchart.NodeStyleDefault)
			nodes = append(nodes, gkoesterNode)
			contents = append(contents, gkoesterContent)

			kpohlNode, kpohlContent := personNode("kalle-pohl", "Kalle Pohl", "Projektmanager", JoeSchmoeGreen, flowchart.Point{
				X: 300,
				Y: 100,
			}, flowchart.NodeTypeDefault, flowchart.NodeStyleDefault)
			nodes = append(nodes, kpohlNode)
			contents = append(contents, kpohlContent)

			gcantzNode, gcantzContent := personNode("guido-cantz", "Guido Cantz", "Projektmanager", JoeSchmoeGreen, flowchart.Point{
				X: 100,
				Y: 100,
			}, flowchart.NodeTypeDefault, flowchart.NodeStyleDefault)
			nodes = append(nodes, gcantzNode)
			contents = append(contents, gcantzContent)

			bstelterNode, bstelterContent := personNode("bernd-stelter", "Bernd Stelter", "Softwareentwickler", JoeSchmoeRed, flowchart.Point{
				X: -100,
				Y: 250,
			}, flowchart.NodeTypeEnd, flowchart.NodeStyleDefault)
			nodes = append(nodes, bstelterNode)
			contents = append(contents, bstelterContent)

			gcantznichtNode, gcantznichtContent := personNode("guido-cantz-nicht", "Guido Cantz Nicht", "Praktikant", JoeSchmoeGreen, flowchart.Point{
				X: 100,
				Y: 250,
			}, flowchart.NodeTypeEnd, flowchart.NodeStyleDefault)
			nodes = append(nodes, gcantznichtNode)
			contents = append(contents, gcantznichtContent)

			colorNode, colorContent := colorNode(colorState, "color", flowchart.Point{
				X: 300,
				Y: 250,
			}, flowchart.NodeTypeDefault)
			nodes = append(nodes, colorNode)
			contents = append(contents, colorContent)

			edges := []flowchart.Edge{
				{
					ID:           "jbusse-gkoester",
					SourceNodeID: "jochen-busse",
					TargetNodeID: "gabi-koester",
					Animated:     true,
				},
				{
					ID:           "jbusse-kpohl",
					SourceNodeID: "jochen-busse",
					TargetNodeID: "kalle-pohl",
					Animated:     true,
				},
				{
					ID:           "jbusse-gcantz",
					SourceNodeID: "jochen-busse",
					TargetNodeID: "guido-cantz",
					Animated:     true,
				},
				{
					ID:             "gkoester-bstelter",
					SourceNodeID:   "gabi-koester",
					TargetNodeID:   "bernd-stelter",
					Label:          "hat entlassen",
					LabelBgColor:   ui.ColorError,
					LabelTextColor: ui.ColorWhite,
					Width:          2,
					Style:          flowchart.EdgeStyleDashed,
					Color:          ui.ColorError,
					MarkerEnd:      flowchart.EdgeMarkerArrow,
				},
				{
					ID:           "gcantz-gcantznicht",
					SourceNodeID: "guido-cantz",
					TargetNodeID: "guido-cantz-nicht",
				},
				{
					ID:           "kpohl-color",
					SourceNodeID: "kalle-pohl",
					TargetNodeID: "color",
					Style:        flowchart.EdgeStyleDotted,
					Color:        ui.ColorSemanticGood,
				},
			}

			state := core.AutoState[flowchart.Model](wnd).Init(func() flowchart.Model {
				return flowchart.Model{
					Nodes: nodes,
					Edges: edges,
				}
			})

			var menu flowchart.Menu
			if menuVisibleState.Get() {
				menu = flowchart.Menu{
					Position: flowchart.Point{
						X: actionState.Get().PaneX,
						Y: actionState.Get().PaneY,
					},
					Content: ui.VStack(
						ui.Text("Menüeintrag"),
						ui.Text("Menüeintrag"),
						ui.Text("Menüeintrag"),
						ui.Text("Menüeintrag"),
						ui.Text("Menüeintrag"),
						ui.Text("Menüeintrag"),
						ui.Text("Menüeintrag"),
						ui.Text("Menüeintrag"),
					).
						BackgroundColor(ui.I0).
						Padding(ui.Padding{}.All(ui.L8)).
						Border(ui.Border{}.Radius(ui.L8).Shadow(ui.L8)),
				}
			}

			chart := flowchart.FlowChart(state.Get()).
				InputValue(state).
				ActionValue(actionState).
				NodesDraggable(true).
				NodesConnectable(true).
				ElementsSelectable(true).
				Background(flowchart.Background{
					Color:   ui.M1,
					GridGap: 16,
				}).
				Frame(ui.Frame{}.MatchScreen()).
				Layout(flowchart.FlowChartLayoutVertical).
				CustomContents(contents).
				MaxZoom(1.5).
				Toolbar(flowchart.Toolbar{
					Actions: []flowchart.FlowChartToolbarAction{flowchart.FlowChartToolbarActionAutoLayout},
				}).
				Menu(menu)

			return ui.Stack(
				chart,
				ui.Stack(
					ui.ThemeSwitcher(ui.PrimaryButton(nil).Title("Toggle theme")),
					ui.SecondaryButton(func() {
						chart.AutoLayout(wnd)
					}).Title("Auto Layout"),
				).Position(ui.Position{
					Type:  ui.PositionFixed,
					Left:  ui.L0,
					Top:   ui.L16,
					Right: ui.L0,
				}).Alignment(ui.Center).
					Gap(ui.L8),
				lastAction(actionState),
			).Frame(ui.Frame{}.MatchScreen())
		})
	}).Run()
}

func personNode(id, name, title string, icon core.SVG, position flowchart.Point, nodeType flowchart.NodeType, style flowchart.NodeStyle) (flowchart.Node, flowchart.CustomContent) {
	var menu core.View
	if strings.Contains(strings.ToLower(name), "kalle") {
		menu = ui.Stack(
			ui.Text("node menu of " + name).
				WhiteSpace(ui.WhiteSpaceNoWrap).
				Font(ui.MonoSmall).
				BackgroundColor(ui.ColorSemanticError).
				Border(ui.Border{}.Radius(ui.L4)).
				Padding(ui.Padding{}.All(ui.L4)),
		)
	}

	return flowchart.Node{
			ID:       id,
			Position: position,
			Label:    name,
			Type:     nodeType,
			Style:    style,
		},
		flowchart.CustomContent{
			NodeID: id,
			Content: ui.VStack(
				ui.ImageIcon(icon),
				ui.VStack(
					ui.Text(name).Font(ui.TitleLarge),
					ui.Text(title).Font(ui.TitleSmall),
				),
			).Gap(ui.L4).Padding(ui.Padding{}.All(ui.L8)),
			Menu: menu,
		}
}

func colorNode(state *core.State[ui.Color], id string, position flowchart.Point, nodeType flowchart.NodeType) (flowchart.Node, flowchart.CustomContent) {
	return flowchart.Node{
			ID:       id,
			Position: position,
			Type:     nodeType,
			Style:    flowchart.NodeStyleNone,
		},
		flowchart.CustomContent{
			NodeID: id,
			Content: ui.VStack(
				colorpicker.PalettePicker("Farbe", colorpicker.DefaultPalette).Value(state.Get()).State(state),
			).Gap(ui.L4).BackgroundColor(state.Get().WithTransparency(50)).Padding(ui.Padding{}.All(ui.L8)).Border(ui.Border{}.Radius(ui.L8)),
		}
}

func lastAction(state *core.State[flowchart.FlowChartActionData]) core.View {
	actionData := state.Get()

	return ui.Stack(
		ui.Grid(
			ui.GridCell(ui.Text("Node:")),
			ui.GridCell(ui.IfElse(len(actionData.Node.ID) > 0, ui.Text(fmt.Sprintf("%+v", actionData.Node)), ui.Text("-"))),
			ui.GridCell(ui.Text("Edge:")),
			ui.GridCell(ui.IfElse(len(actionData.Edge.ID) > 0, ui.Text(fmt.Sprintf("%+v", actionData.Edge)), ui.Text("-"))),
			ui.GridCell(ui.Text("Pane Point:")),
			ui.GridCell(ui.Text(fmt.Sprintf("%d %d", int(actionData.PaneX), int(actionData.PaneY)))),
			ui.GridCell(ui.Text("View Point:")),
			ui.GridCell(ui.Text(fmt.Sprintf("%d %d", int(actionData.ViewX), int(actionData.ViewY)))),
			ui.GridCell(ui.Text("Selected nodes:")),
			ui.GridCell(ui.Text(fmt.Sprintf("%+v", actionData.SelectedNodes))),
			ui.GridCell(ui.Text("Selected edges:")),
			ui.GridCell(ui.Text(fmt.Sprintf("%+v", actionData.SelectedEdges))),
			ui.GridCell(ui.Text("Right click:")),
			ui.GridCell(ui.Text(fmt.Sprintf("%t", actionData.RightClick))),
		).
			Columns(2).
			RowGap(ui.L2).
			ColGap(ui.L8).
			Widths("auto", "auto"),
	).
		Position(ui.Position{
			Type:   ui.PositionAbsolute,
			Left:   ui.L0,
			Bottom: ui.L0,
		}).
		BackgroundColor(ui.ColorBackground.WithTransparency(10)).
		Font(ui.MonoSmall).
		Padding(ui.Padding{}.All(ui.L8))
}
View on GitHub ↗
· run it with go run go.wdy.de/nago/example/cmd/tutorial-98-flow-chart@latest